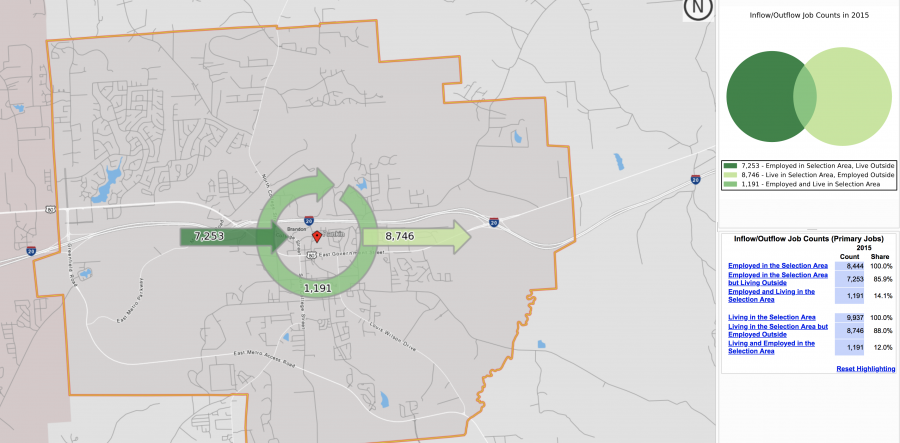
Inflow/Outflow Report
| 2015 | ||
| Count | Share | |
| Employed in the Selection Area | 8,444 | 100.0% |
| Living in the Selection Area | 9,937 | 115.3% |
| Net Job Inflow (+) or Outflow (-) | -1,493 | – |
| 2015 | ||
| Count | Share | |
| Living in the Selection Area | 9,937 | 100.0% |
| Living and Employed in the Selection Area | 1,191 | 12.0% |
| Living in the Selection Area but Employed Outside | 8,746 | 88.0% |
| 2015 | ||
| Count | Share | |
| Employed in the Selection Area | 8,444 | 100.0% |
| Employed and Living in the Selection Area | 1,191 | 14.1% |
| Employed in the Selection Area but Living Outside | 7,253 | 85.9% |
| 2015 | ||
| Count | Share | |
| External Jobs Filled by Residents | 8,746 | 100.0% |
| Workers Aged 29 or younger | 1,750 | 20.0% |
| Workers Aged 30 to 54 | 5,077 | 58.0% |
| Workers Aged 55 or older | 1,919 | 21.9% |
| Workers Earning $1,250 per month or less | 1,360 | 15.5% |
| Workers Earning $1,251 to $3,333 per month | 2,940 | 33.6% |
| Workers Earning More than $3,333 per month | 4,446 | 50.8% |
| Workers in the “Goods Producing” Industry Class | 1,151 | 13.2% |
| Workers in the “Trade, Transportation, and Utilities” Industry Class | 1,935 | 22.1% |
| Workers in the “All Other Services” Industry Class | 5,660 | 64.7% |
| 2015 | ||
| Count | Share | |
| Internal Jobs Filled by Outside Workers | 7,253 | 100.0% |
| Workers Aged 29 or younger | 1,961 | 27.0% |
| Workers Aged 30 to 54 | 3,853 | 53.1% |
| Workers Aged 55 or older | 1,439 | 19.8% |
| Workers Earning $1,250 per month or less | 2,056 | 28.3% |
| Workers Earning $1,251 to $3,333 per month | 2,781 | 38.3% |
| Workers Earning More than $3,333 per month | 2,416 | 33.3% |
| Workers in the “Goods Producing” Industry Class | 502 | 6.9% |
| Workers in the “Trade, Transportation, and Utilities” Industry Class | 1,789 | 24.7% |
| Workers in the “All Other Services” Industry Class | 4,962 | 68.4% |


